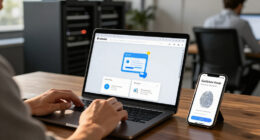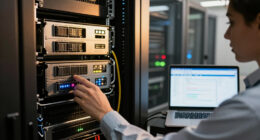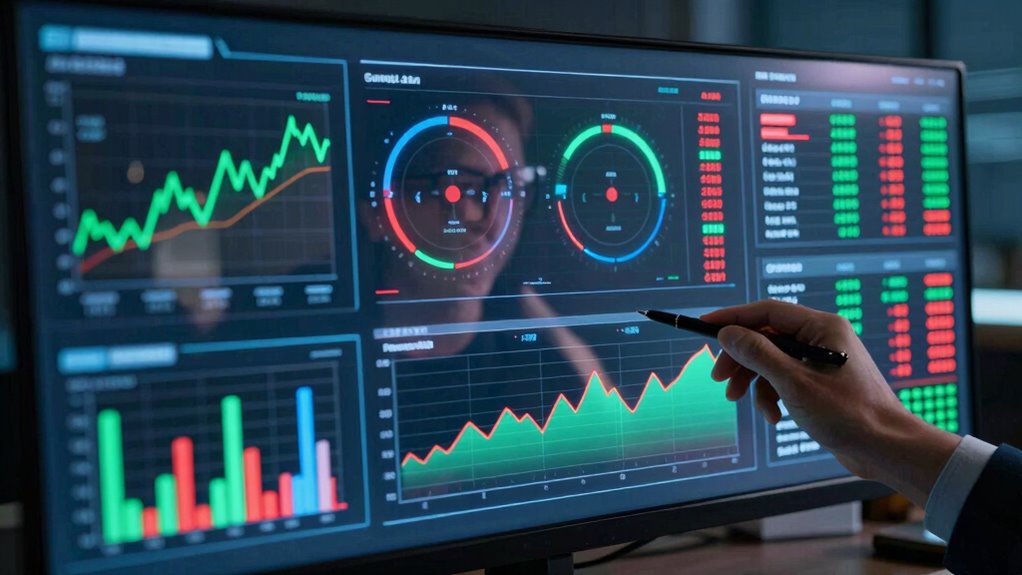

Many organizations believe their incident dashboard is all-encompassing, but in reality, most lack a truly real-time, integrated system that shows the full, current picture needed for quick responses. Often, dashboards display outdated data or partial views, causing delays and missed threats. An effective incident dashboard should be dynamic, continuously updating with live feeds and clear visuals. If you want to discover what makes a dashboard truly effective, keep exploring these key insights.

Get business pricing on networking and server gear
- Business-only prices and quantity discounts
- Tax-exempt purchasing
- Multiple users, one account, clear invoices
Key Takeaways
- Many organizations assume their dashboards are comprehensive, but they often lack real-time, complete incident data.
- Effective incident dashboards are dynamic, providing instant updates rather than static or outdated information.
- Poor UI design can make dashboards appear comprehensive while hiding critical alerts or details.
- Integration and automation are essential for accurate, timely incident awareness, often missing in traditional dashboards.
- Continuous user feedback and customization are necessary to maintain a truly effective, reliable incident monitoring system.

Many organizations believe they have an exhaustive incident dashboard, but in reality, most only have partial or outdated views of their incident data. They assume that their dashboards provide a complete picture, yet often, these tools fall short when it comes to delivering real-time insights needed during critical moments. A truly effective incident dashboard isn’t just a collection of charts and logs; it’s a dynamic, real-time monitoring system that updates instantly as incidents unfold. Without this continuous flow of fresh data, your team risks making decisions based on stale or incomplete information, which can lead to delays, miscommunications, or worse—missed threats altogether.
Many dashboards are outdated or incomplete, risking delayed responses and missed threats without real-time updates.
Achieving an effective incident dashboard hinges heavily on user interface design. If your dashboard is cluttered, confusing, or difficult to interpret quickly, it loses its value in high-pressure situations. Good user interface design prioritizes clarity and usability—think minimalism, logical grouping, and intuitive navigation. When you design with the end-user in mind, you enable your team to identify critical issues at a glance, reducing response times and increasing confidence in the data presented. Complex visualizations or poorly labeled metrics only slow down decision-making, especially when every second counts. An optimized user interface ensures that your incident data is accessible, digestible, and actionable. Additionally, integrating real-time data feeds seamlessly into your user interface can significantly enhance situational awareness and decision speed. Incorporating automated alerting systems can further improve response times by notifying teams immediately when anomalies are detected. Ensuring your dashboard is highly customizable allows teams to tailor views to their specific operational needs, improving overall effectiveness. Moreover, paying attention to user feedback during the design process helps ensure the dashboard remains effective and user-friendly over time.
real-time incident monitoring dashboard
As an affiliate, we earn on qualifying purchases.
As an affiliate, we earn on qualifying purchases.
Frequently Asked Questions
How Do I Tailor an Incident Dashboard to My Organization’s Needs?
To tailor an incident dashboard to your organization’s needs, focus on user engagement by involving stakeholders early. Use data visualization techniques that highlight key metrics relevant to your team’s priorities. Customize filters and views so users can access specific incident data quickly. Regularly gather feedback to refine the dashboard’s layout and content, ensuring it remains useful and engaging, ultimately improving incident response and decision-making.
What Are Common Pitfalls in Creating an Effective Incident Dashboard?
You risk cluttering your dashboard with unnecessary data, which hampers effective data visualization and user engagement. Avoid overloading it with too many metrics or complex visuals, as this can confuse users and reduce usability. Make sure your design highlights key incident trends clearly, making it easy for users to interpret. Regularly gather feedback to refine the dashboard, keeping user engagement high and ensuring it truly meets your organization’s needs.
How Often Should Incident Dashboards Be Updated?
Like a vigilant lighthouse keeper, you should update your incident dashboard regularly to guarantee clear data visualization and effective real-time monitoring. Ideally, updates happen at least daily or whenever new incidents emerge, so your team always has current insights. Frequent updates prevent outdated information from guiding poor decisions, allowing you to respond swiftly. Consistent refreshes maintain trust and keep your incident management proactive rather than reactive.
What Tools or Software Are Best for Incident Dashboard Creation?
You should consider tools like Power BI, Tableau, or Datadog for incident dashboards. These platforms support real-time monitoring, ensuring you get up-to-the-minute data on incidents. They also offer extensive user customization, allowing you to tailor dashboards to your specific needs. By choosing one of these tools, you’ll be able to create effective, dynamic incident dashboards that improve visibility and response times.
How Can Incident Dashboards Improve Overall Incident Response?
Incident dashboards enhance your response by providing clear incident visualization and real-time access to response metrics. When you have a centralized view, you can quickly identify issues, prioritize actions, and allocate resources more effectively. This streamlines communication, reduces response times, and boosts overall efficiency. By continuously monitoring key metrics, you stay proactive, ensuring faster resolution and minimizing impact, ultimately strengthening your incident management process.
incident management dashboard software
As an affiliate, we earn on qualifying purchases.
As an affiliate, we earn on qualifying purchases.
Conclusion
Without a clear, real-time incident dashboard, managing crises is like sailing without a compass—you might be moving, but you’re unlikely to reach your destination efficiently. Many teams believe they have a handle on incidents, but without proper tools, they’re just guessing in the dark. To truly stay ahead, invest in a dashboard that offers clarity and control. It’s the lighthouse guiding you through the storm, ensuring you navigate crises swiftly and smoothly.
automated alert system for IT incidents
As an affiliate, we earn on qualifying purchases.
As an affiliate, we earn on qualifying purchases.
As an affiliate, we earn on qualifying purchases.
Fall Picks
fall essentials
As an affiliate, we earn on qualifying purchases.