

An effective showback report clearly explains how costs are allocated across departments or projects, using visuals like charts and graphs to highlight trends and anomalies. It guarantees transparency by detailing the allocation methodology and maintaining consistent terminology, which builds trust. The report should be based on reliable data, regularly updated, and presented in a format that encourages engagement and questions. Keep exploring to discover more ways to make your reports impactful and actionable.

Get business pricing on networking and server gear
- Business-only prices and quantity discounts
- Tax-exempt purchasing
- Multiple users, one account, clear invoices
Key Takeaways
- Clearly explain the cost allocation methodology and categories to ensure transparency and fairness.
- Use visual elements like charts and graphs to highlight trends, anomalies, and comparisons for quick understanding.
- Base the report on reliable, consistently updated data aligned with organizational accounting practices.
- Include contextual insights, such as budget vs. actual comparisons, to make the report actionable.
- Invite stakeholder feedback and provide contact points to foster engagement and continuous improvement.
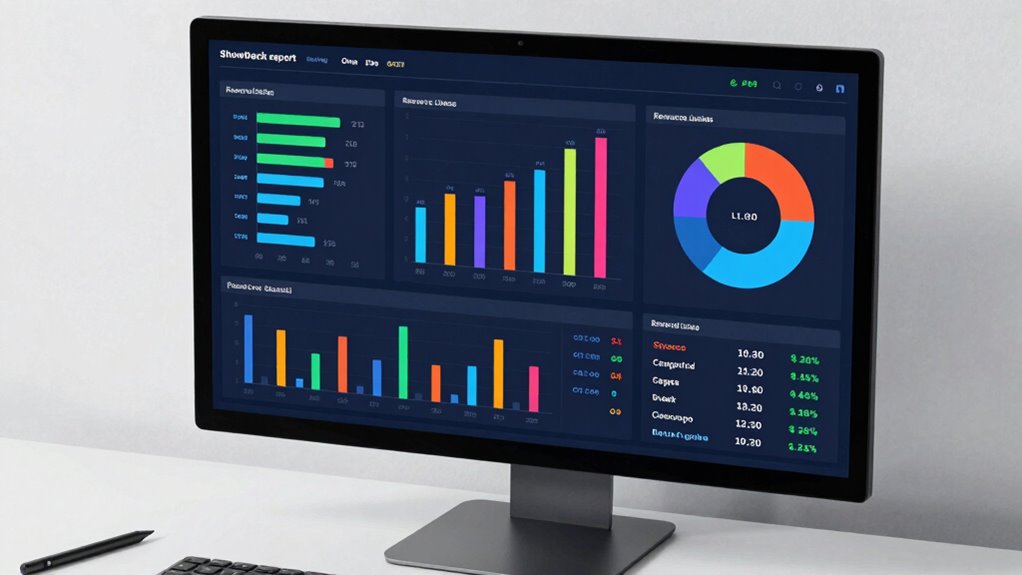
Ever wondered how to make your showback reports truly effective? The key lies in creating reports that clearly communicate how costs are allocated across departments or projects, fostering a sense of ownership and accountability. An effective showback report should accurately reflect the cost allocation process, ensuring each team understands exactly how their usage contributes to overall expenses. When you prioritize transparency, everyone gains insight into where resources are going, which supports better decision-making and encourages responsible consumption of IT or other shared services.
A well-designed showback report doesn’t just list numbers; it tells a story. It breaks down costs into easily understandable categories, such as infrastructure, software, or support services. This breakdown helps users see exactly which components drive costs and where efficiencies can be gained. When the report emphasizes budget transparency, it reduces confusion or suspicion about how expenses are calculated. Clear explanations of the allocation methodology—whether based on usage, headcount, or another metric—build trust and eliminate doubts about fairness. Including detailed descriptions of how costs are assigned ensures that all stakeholders understand the process and its fairness.
Visual clarity is another hallmark of an effective showback report. Use charts, graphs, and color coding to highlight trends, anomalies, or areas of concern. For example, a line graph showing month-over-month cost changes can quickly alert managers to unusual spikes, prompting timely investigation. Visuals make complex data more digestible, ensuring that stakeholders grasp the key insights without getting lost in spreadsheets. Including comparisons against budgets or forecasts further enhances transparency, enabling teams to see how actuals stack up against planned expenses.
Accuracy and consistency are fundamental. Your report should be based on reliable data sources, regularly updated, and aligned with your organization’s accounting practices. Consistent formatting and terminology help users become familiar with the report’s structure, making it easier to interpret over time. When you maintain this level of rigor, your showback reports become trusted tools for financial oversight, not just periodic summaries. Incorporating cost allocation methods that are aligned with organizational policies ensures clarity and fairness in the process. Additionally, implementing automated data collection can help reduce errors and improve overall accuracy.
Finally, an effective showback report invites feedback and discussion. Provide clear contact points for questions and encourage teams to challenge or clarify figures. This interaction fosters a culture of openness, where everyone feels responsible for understanding and managing their costs. When users see that the report is both transparent and actionable, they’re more likely to engage actively, leading to smarter resource management and better financial health for the organization.
business data visualization charts
As an affiliate, we earn on qualifying purchases.
As an affiliate, we earn on qualifying purchases.
Frequently Asked Questions
How Often Should a Showback Report Be Updated?
You should update a showback report regularly, ideally monthly, to guarantee accurate cost allocation and maintain billing accuracy. Frequent updates help you catch discrepancies early, reflect recent usage changes, and provide stakeholders with timely insights. Consistent review also supports better decision-making and cost management. By keeping your report current, you ensure that allocations are fair and billing remains transparent, ultimately fostering trust and financial accountability across your organization.
What Metrics Are Most Important in a Showback Report?
You need to focus on metrics that reveal the true story behind your costs, like cost allocation accuracy and usage transparency. These metrics are the backbone of any effective showback report, illuminating how resources are used and assigned. Ignoring them is like steering through a storm without a compass—you’re flying blind. Prioritize these to ensure your report provides clear, actionable insights into resource consumption and financial accountability.
How Do You Handle Discrepancies in Resource Usage Data?
When handling discrepancies in resource usage data, you should first verify data accuracy by cross-checking with source systems. Use clear communication to identify if the issue stems from measurement errors or reporting delays. To guarantee precise cost allocation, adjust the data accordingly and document any changes. Regular audits help maintain data integrity, making sure your showback report accurately reflects resource consumption, leading to fair and transparent cost allocation.
Can Showback Reports Be Customized for Different Departments?
Yes, you can customize showback reports for different departments. You should incorporate department-specific metrics that reflect each team’s unique resource usage and cost drivers. Use customized reporting formats to make the data more relevant and easier to interpret for each department. Tailoring the reports enhances understanding, encourages accountability, and helps teams identify ways to optimize their resource consumption effectively.
What Tools Are Recommended for Creating Showback Reports?
You should consider tools like Microsoft Excel, Google Data Studio, or Tableau for creating showback reports. These tools excel in data visualization, making complex cost allocation data easy to understand. They allow you to customize reports for different departments, ensuring clarity and transparency. By leveraging these tools, you can effectively communicate cost insights, track departmental expenses, and optimize resource distribution, all while maintaining accuracy and visual appeal.
As an affiliate, we earn on qualifying purchases.
Conclusion
Imagine standing at the helm of your showback report, confidently steering through clear, detailed data as if steering familiar waters. With an effective report in hand, you can spot trends and address costs before they drift out of control. It’s like having a lighthouse guiding your decisions, illuminating the way forward. When your report is sharp and transparent, you’re not just reacting—you’re proactively shaping your financial voyage, ensuring smooth sailing ahead.
As an affiliate, we earn on qualifying purchases.
As an affiliate, we earn on qualifying purchases.
Columbus Day / Indigenous Peoples' Day Picks
long weekend sales
As an affiliate, we earn on qualifying purchases.